

Cybersecurity exposure management company Tenable (NASDAQ:TENB) reported revenue ahead of Wall Street’s expectations in Q2 CY2026, with sales up 8.6% year on year to $268.5 million. Guidance for next quarter’s revenue was better than expected at $271.5 million at the midpoint, 0.6% above analysts’ estimates. Its non-GAAP profit of $0.51 per share was 8.6% above analysts’ consensus estimates.
Is now the time to buy Tenable? Find out by accessing our full research report, it’s free.
Tenable (TENB) Q2 CY2026 Highlights:
- Revenue: $268.5 million vs analyst estimates of $264.8 million (8.6% year-on-year growth, 1.4% beat)
- Adjusted EPS: $0.51 vs analyst estimates of $0.47 (8.6% beat)
- Adjusted Operating Income: $66.19 million vs analyst estimates of $62.39 million (24.7% margin, 6.1% beat)
- The company slightly lifted its revenue guidance for the full year to $1.08 billion at the midpoint from $1.07 billion
- Management raised its full-year Adjusted EPS guidance to $1.98 at the midpoint, a 1.8% increase
- Operating Margin: 4.6%, up from -3% in the same quarter last year
- Free Cash Flow Margin: 14.6%, down from 31.5% in the previous quarter
- Market Capitalization: $3.46 billion
"We delivered better-than-expected results in Q2, reflecting the continued momentum in Tenable One," said Steve Vintz, Co-CEO of Tenable.
Company Overview
Starting with the widely-used Nessus vulnerability scanner first released in 1998, Tenable (NASDAQ:TENB) provides exposure management solutions that help organizations identify, assess, and prioritize cybersecurity vulnerabilities across their IT infrastructure and cloud environments.
Revenue Growth
A company’s long-term sales performance is one signal of its overall quality. Any business can put up a good quarter or two, but the best consistently grow over the long haul. Over the last five years, Tenable grew its sales at a 16.6% compounded annual growth rate. Though this growth is acceptable on an absolute basis, we need to see more than just topline growth for the software sector, which can display significant earnings volatility. This means our bar for the sector is particularly high, reflecting the non-essential and hit-driven nature of the products and services offered. Additionally, five-year CAGR starts around Covid, when revenue was depressed then rebounded.
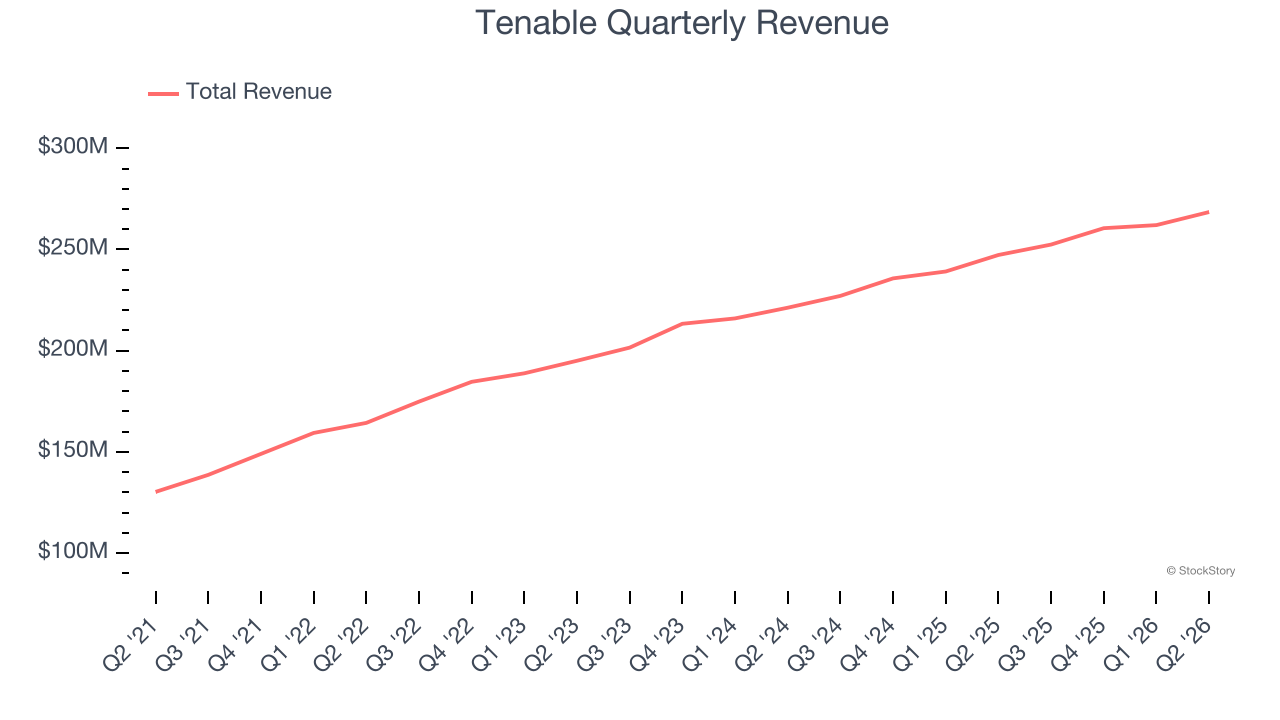
Long-term growth is the most important, but within software, a half-decade historical view may miss new innovations or demand cycles. Tenable’s recent performance shows its demand has slowed as its annualized revenue growth of 10.7% over the last two years was below its five-year trend. We’re wary when companies in the sector see decelerations in revenue growth, as it could signal changing consumer tastes aided by low switching costs. 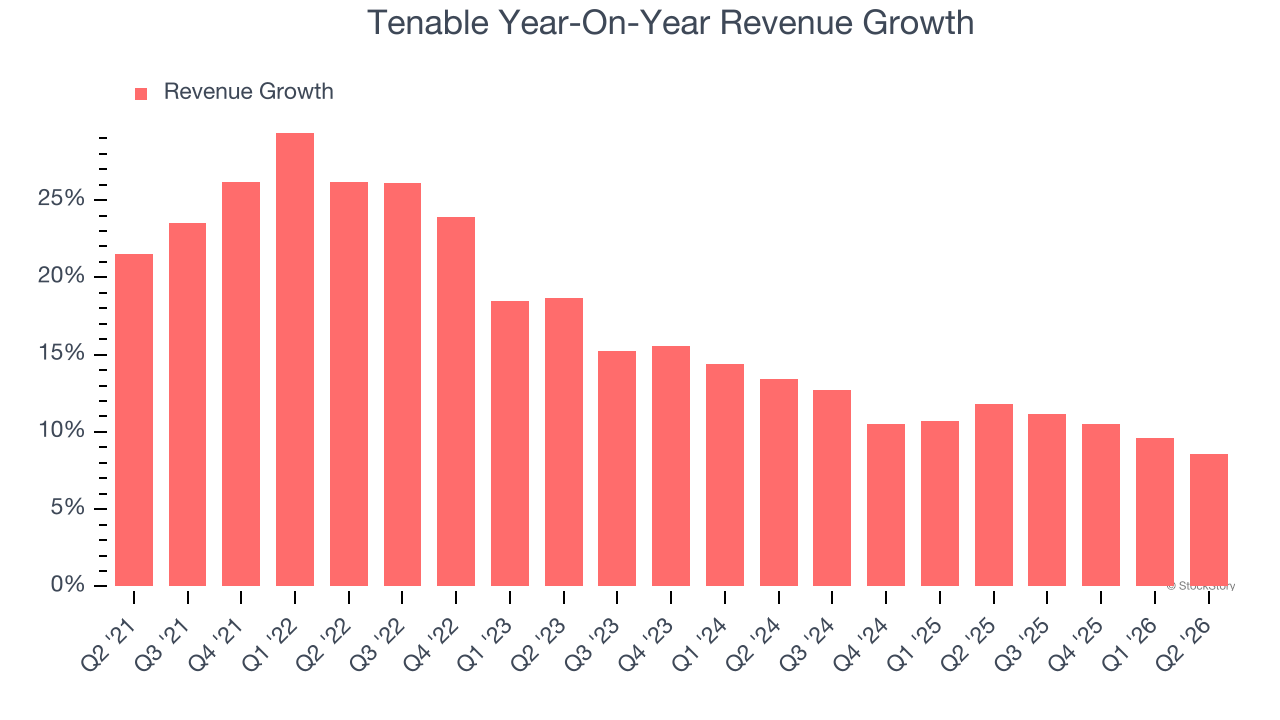
This quarter, Tenable reported year-on-year revenue growth of 8.6%, and its $268.5 million of revenue exceeded Wall Street’s estimates by 1.4%. Company management is currently guiding for a 7.6% year-on-year increase in sales next quarter.
Looking further ahead, sell-side analysts expect revenue to grow 6.4% over the next 12 months, a deceleration versus the last two years. This projection is underwhelming and suggests its products and services will see some demand headwinds.
WHILE YOU’RE HERE: The Next Palantir? One satellite company captures images of every point on Earth. Every single day. The Pentagon wants it. Hedge funds are using it to beat earnings. You’ve probably never heard of it.
This is what the early days of Palantir looked like before it became a giant. Same playbook. Different technology. If you missed Palantir, you need to see this. Claim The Stock Ticker for Free HERE.
Customer Acquisition Efficiency
The customer acquisition cost (CAC) payback period represents the months required to recover the cost of acquiring a new customer. Essentially, it’s the break-even point for sales and marketing investments. A shorter CAC payback period is ideal, as it implies better returns on investment and business scalability.
It’s relatively expensive for Tenable to acquire new customers as its CAC payback period checked in at 114.9 months this quarter. The company’s slow recovery of its sales and marketing expenses indicates it operates in a highly competitive market and must invest to stand out, even if the return on that investment is low.
Key Takeaways from Tenable’s Q2 Results
We enjoyed seeing Tenable beat analysts’ adjusted operating income expectations this quarter. We were also glad its EPS guidance for next quarter exceeded Wall Street’s estimates. Overall, we think this was still a solid quarter with some key areas of upside. The market seemed to be hoping for more, and the stock traded down 4% to $30.21 immediately after reporting.
Should you buy the stock or not? If you’re making that decision, you should consider the bigger picture of valuation, business qualities, as well as the latest earnings. We cover that in our actionable full research report which you can read here (it’s free).