

Healthcare distributor Cencora (NYSE:COR) reported Q2 CY2025 results beating Wall Street’s revenue expectations, with sales up 8.7% year on year to $80.66 billion. Its non-GAAP profit of $4 per share was 4.2% above analysts’ consensus estimates.
Is now the time to buy Cencora? Find out by accessing our full research report, it’s free.
Cencora (COR) Q2 CY2025 Highlights:
- Revenue: $80.66 billion vs analyst estimates of $79.82 billion (8.7% year-on-year growth, 1.1% beat)
- Adjusted EPS: $4 vs analyst estimates of $3.84 (4.2% beat)
- Adjusted EPS guidance for the full year is $15.93 at the midpoint, beating analyst estimates by 0.6%
- Operating Margin: 1.1%, in line with the same quarter last year
- Free Cash Flow was -$73.97 million, down from $2.36 billion in the same quarter last year
- Market Capitalization: $56.66 billion
“Cencora delivered strong financial results in the third fiscal quarter, driven by our pharmaceutical-centric strategy and focus on our growth priorities,” said Robert P. Mauch, President and Chief Executive Officer of Cencora.
Company Overview
Formerly known as AmerisourceBergen until its 2023 rebranding, Cencora (NYSE:COR) is a global pharmaceutical distribution company that connects manufacturers with healthcare providers while offering logistics, data analytics, and consulting services.
Revenue Growth
A company’s long-term performance is an indicator of its overall quality. Any business can put up a good quarter or two, but the best consistently grow over the long haul. Thankfully, Cencora’s 11.2% annualized revenue growth over the last five years was decent. Its growth was slightly above the average healthcare company and shows its offerings resonate with customers.
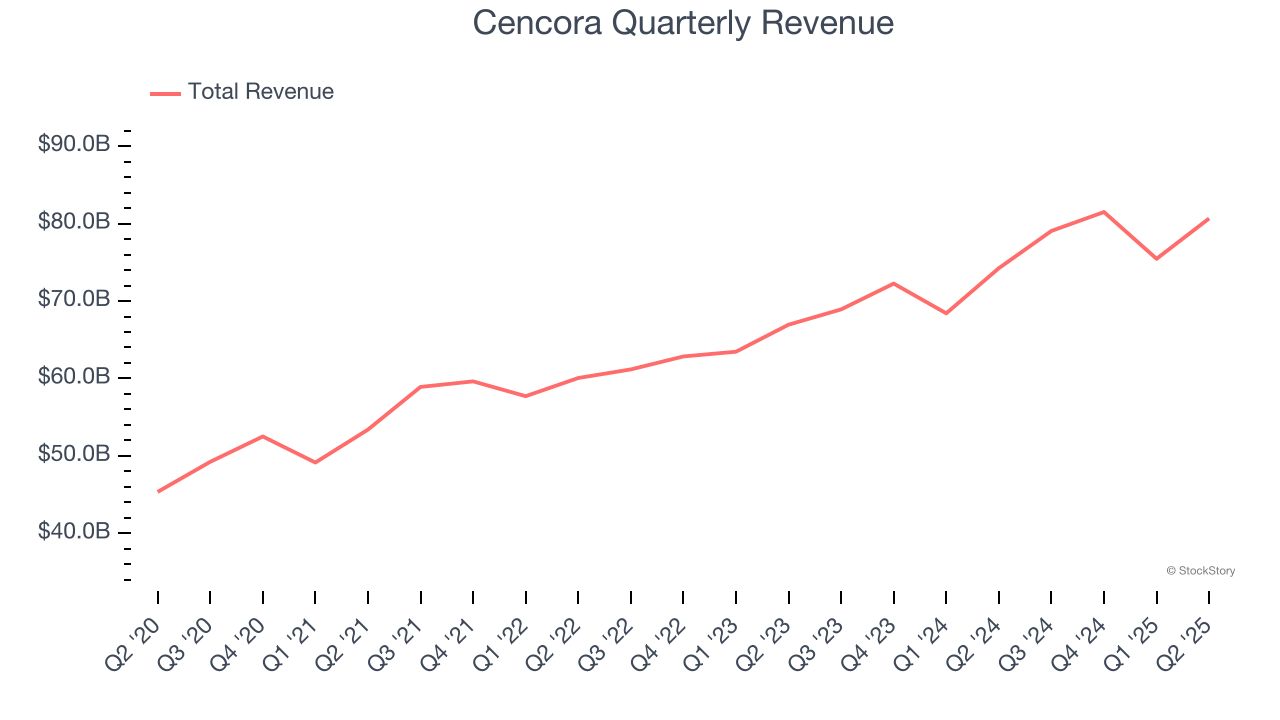
Long-term growth is the most important, but within healthcare, a half-decade historical view may miss new innovations or demand cycles. Cencora’s annualized revenue growth of 11.6% over the last two years aligns with its five-year trend, suggesting its demand was stable. 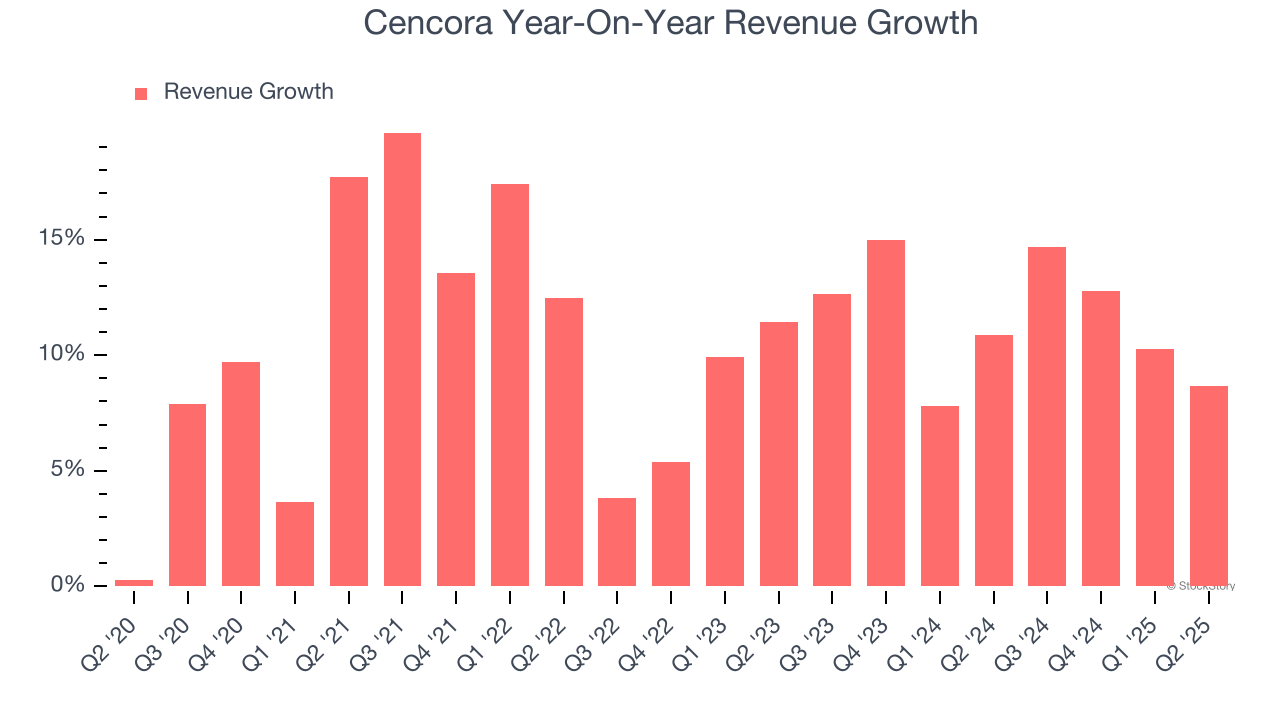
We can dig further into the company’s revenue dynamics by analyzing its most important segment, US Healthcare. Over the last two years, Cencora’s US Healthcare revenue averaged 12.3% year-on-year growth. 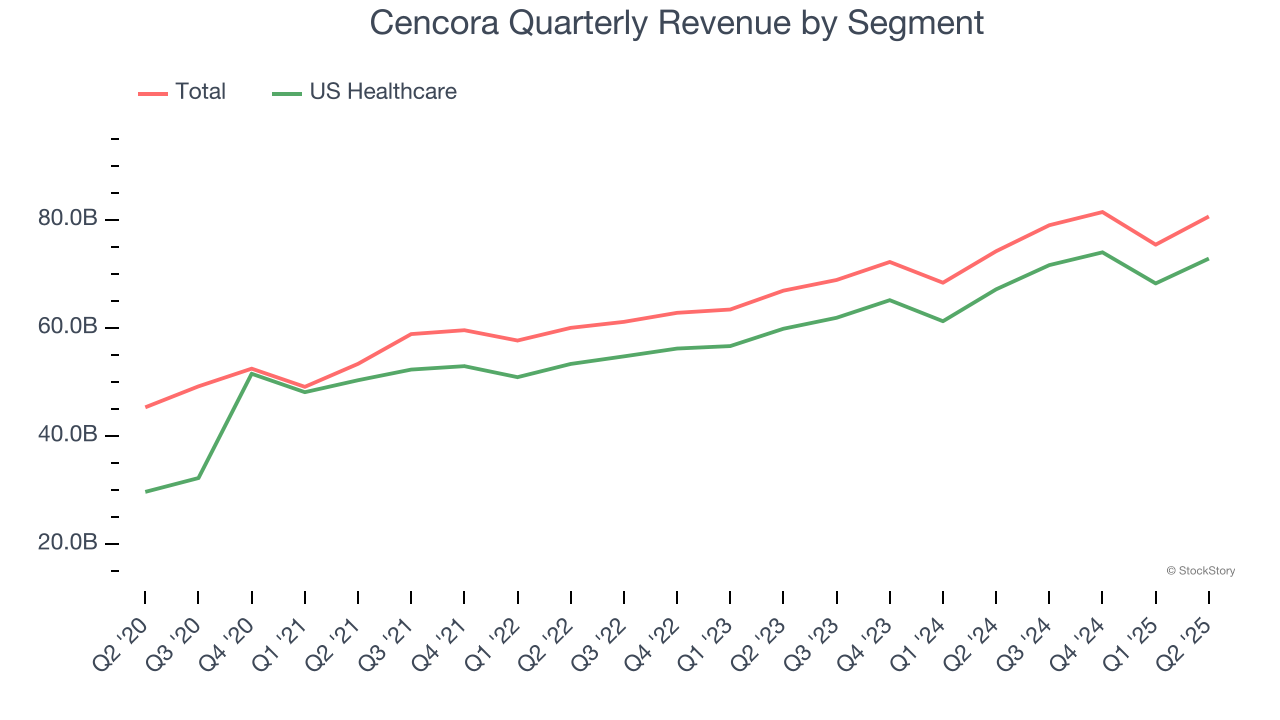
This quarter, Cencora reported year-on-year revenue growth of 8.7%, and its $80.66 billion of revenue exceeded Wall Street’s estimates by 1.1%.
Looking ahead, sell-side analysts expect revenue to grow 6.2% over the next 12 months, a deceleration versus the last two years. We still think its growth trajectory is satisfactory given its scale and suggests the market is forecasting success for its products and services.
Today’s young investors won’t have read the timeless lessons in Gorilla Game: Picking Winners In High Technology because it was written more than 20 years ago when Microsoft and Apple were first establishing their supremacy. But if we apply the same principles, then enterprise software stocks leveraging their own generative AI capabilities may well be the Gorillas of the future. So, in that spirit, we are excited to present our Special Free Report on a profitable, fast-growing enterprise software stock that is already riding the automation wave and looking to catch the generative AI next.
Operating Margin
Operating margin is a key measure of profitability. Think of it as net income - the bottom line - excluding the impact of taxes and interest on debt, which are less connected to business fundamentals.
Cencora was roughly breakeven when averaging the last five years of quarterly operating profits, lousy for a healthcare business.
On the plus side, Cencora’s operating margin rose by 3 percentage points over the last five years, as its sales growth gave it operating leverage.
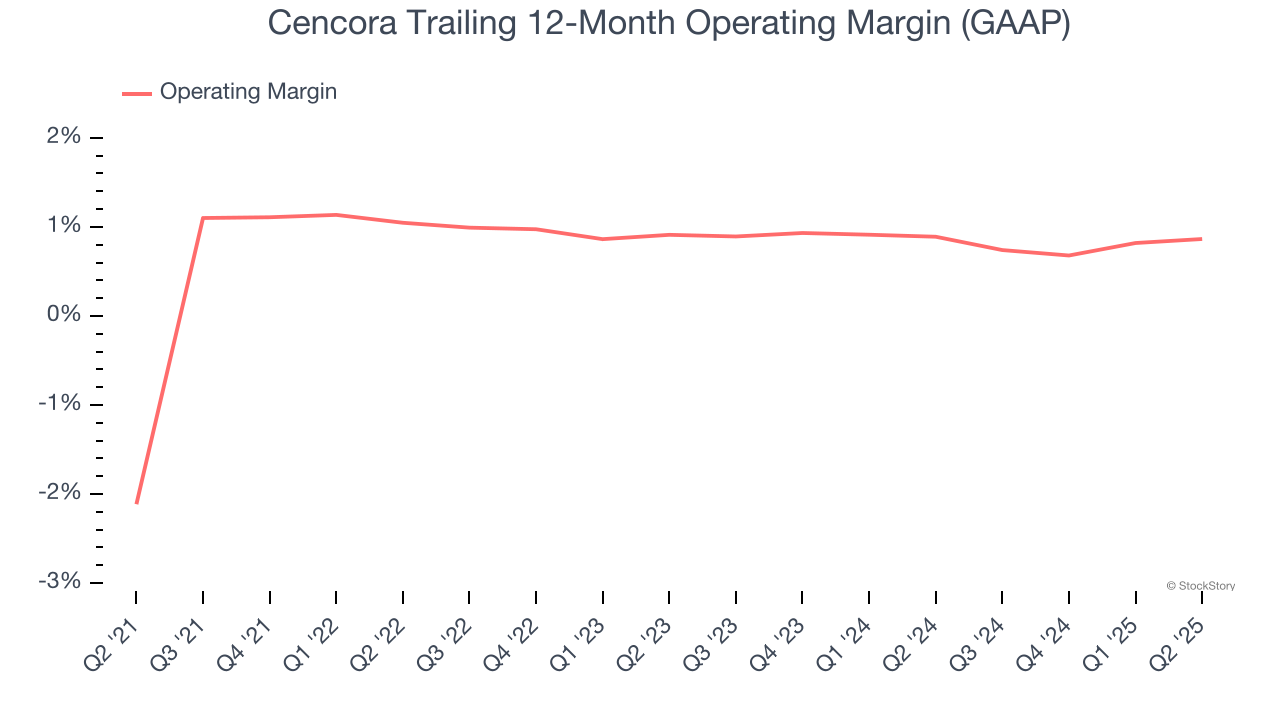
This quarter, Cencora generated an operating margin profit margin of 1.1%, in line with the same quarter last year. This indicates the company’s overall cost structure has been relatively stable.
Earnings Per Share
Revenue trends explain a company’s historical growth, but the long-term change in earnings per share (EPS) points to the profitability of that growth – for example, a company could inflate its sales through excessive spending on advertising and promotions.
Cencora’s EPS grew at an astounding 15.2% compounded annual growth rate over the last five years, higher than its 11.2% annualized revenue growth. This tells us the company became more profitable on a per-share basis as it expanded.
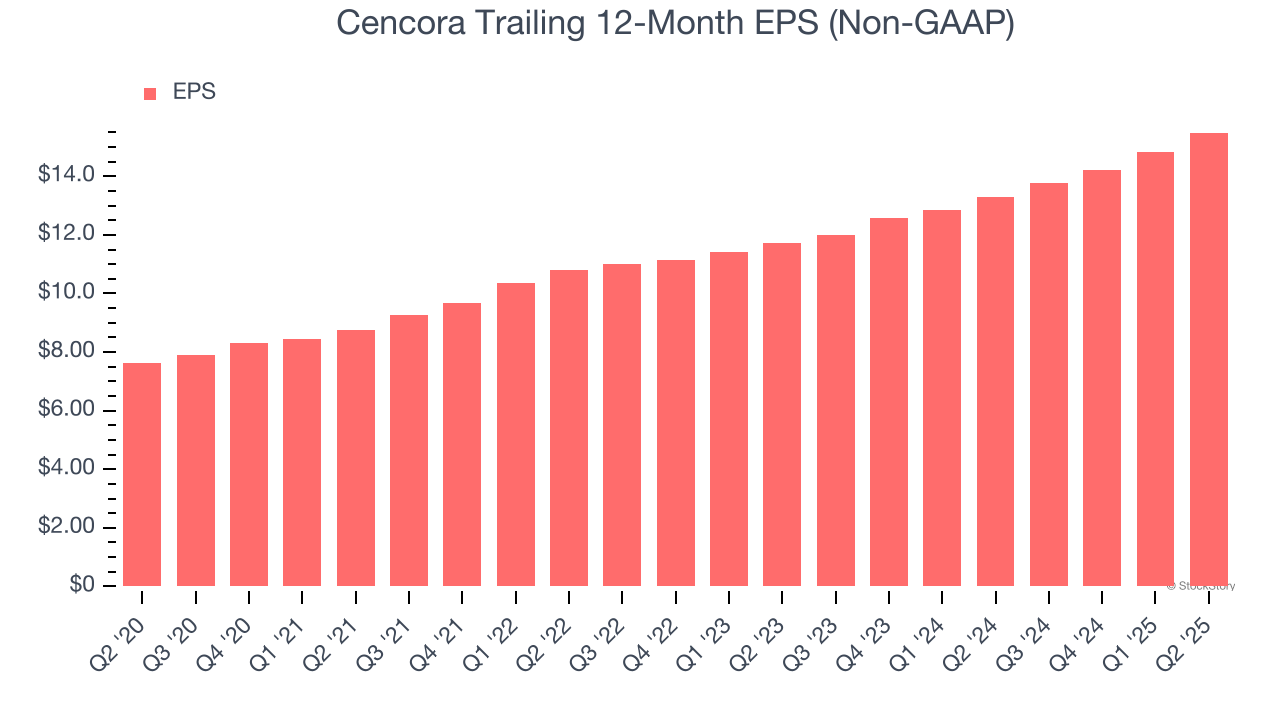
We can take a deeper look into Cencora’s earnings to better understand the drivers of its performance. As we mentioned earlier, Cencora’s operating margin was flat this quarter but expanded by 3 percentage points over the last five years. On top of that, its share count shrank by 5%. These are positive signs for shareholders because improving profitability and share buybacks turbocharge EPS growth relative to revenue growth. 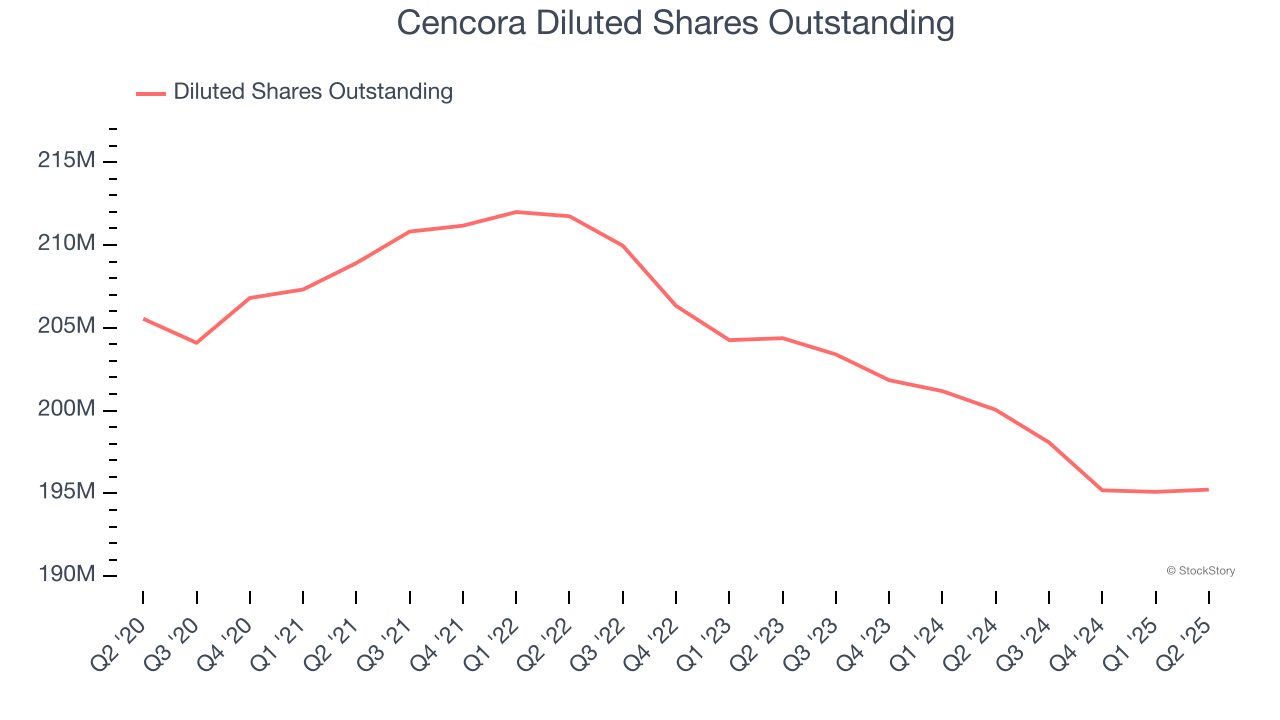
In Q2, Cencora reported adjusted EPS at $4, up from $3.34 in the same quarter last year. This print beat analysts’ estimates by 4.2%. Over the next 12 months, Wall Street expects Cencora’s full-year EPS of $15.49 to grow 9.7%.
Key Takeaways from Cencora’s Q2 Results
It was good to see Cencora narrowly top analysts’ revenue expectations this quarter. We were also happy its EPS outperformed Wall Street’s estimates. Overall, this print had some key positives. The stock traded up 1.6% to $296.99 immediately after reporting.
So should you invest in Cencora right now? The latest quarter does matter, but not nearly as much as longer-term fundamentals and valuation, when deciding if the stock is a buy. We cover that in our actionable full research report which you can read here, it’s free.