
“PACCAR reported good revenues and increased net income in the first quarter of 2026 compared to the fourth quarter last year,” said Preston Feight, chief executive officer. “These results were generated by strong PACCAR Parts and Financial Services results and growth in the truck businesses. PACCAR’s production backlog is increasing due to stronger demand. I am very proud of our employees and dealers who have delivered outstanding trucks and transportation solutions to our customers.”
This press release features multimedia. View the full release here: https://www.businesswire.com/news/home/20260428555303/en/
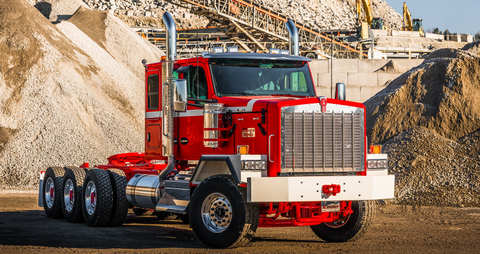
Kenworth C580 Vocational Truck
PACCAR achieved quarterly revenues of $6.78 billion in the first quarter of 2026, compared to $7.44 billion reported in the same period in 2025. The company reported net income of $605.3 million ($1.15 per diluted share) in the first quarter of 2026, compared to $505.1 million ($.96 per diluted share), which included a $264.5 million after-tax charge related to civil litigation in Europe, in the first quarter of last year.
Highlights – First Quarter 2026
Highlights of PACCAR’s financial results during the first quarter of 2026 include:
- Consolidated revenues of $6.78 billion.
- Net income of $605.3 million.
- PACCAR Parts revenue of $1.71 billion.
- PACCAR Parts pretax income of $402.3 million.
- PACCAR Financial Services pretax income of $115.5 million.
- Cash provided by operations of $971.8 million.
- Capital investment of $135.5 million and R&D expense of $109.1 million.
- Stockholders’ equity of $19.76 billion.
Global Truck Markets
Kevin Baney, PACCAR president, said, “The U.S. and Canada truck market has enjoyed a positive inflection as customers benefit from higher freight rates due to reduced trucking industry capacity. Customer demand is improving despite fuel and other operating cost volatility as customers now have a better understanding of the 2027 emissions cost impact.” U.S. and Canada Class 8 truck industry retail sales are estimated to be in a range of 230,000-270,000 trucks in 2026.
European truck industry registrations for the above 16-tonne market in 2026 are projected to be in a range of 280,000-320,000 trucks. “The aerodynamic and spacious DAF trucks offer industry-leading fuel efficiency and driver comfort to customers,” said Harald Seidel, DAF president. “In the first quarter, DAF Trucks introduced new DAF XG and XG+ Electric trucks. The DAF XF Electric truck was recognized as the ‘2026 Eco-Friendly Truck of the Year’ by the prestigious National Transport Awards program in Spain.”
The South American above 16-tonne truck market is projected to be in the range of 100,000-110,000 trucks in 2026. “Kenworth and DAF trucks are renowned for their durability and advanced engineering, making them best-in-class for the challenging duty cycles of South America,” said Lance Walters, PACCAR vice president. “Customers value Kenworth and DAF’s strong aftermarket parts and service dealer network, which enhances uptime and profitability.”
Kenworth Introduces C580 Heavy-Duty Vocational Truck
Kenworth unveiled the new Kenworth C580 truck at the CONEXPO trade show in Las Vegas, reinforcing Kenworth’s leadership position in the heavy-duty vocational segment. The C580 is designed to meet the most demanding vocational applications, such as mining and off-highway petroleum field work. The C580 combines proven durability with the modern comfort and technology of Kenworth’s latest cab platform. Production of the C580 is scheduled to begin in January 2027.
DAF Launches Battery-Electric Vocational Trucks
DAF Trucks has expanded its range of battery-electric trucks to include multiple axle tractor and rigid models for specific vocational applications such as construction. The new chassis models are available for the XD and XF Electric – ‘International Truck of the Year 2026’ – and for the larger XG and XG+ Electric, which feature the most spacious cabs in the European truck market.
DAF XD, XF, XG and XG+ Electric trucks provide zero emissions ranges of up to 300 miles, depending on the application duty cycle and the number of battery packs. Customers benefit from DAF’s close collaboration with leading bodywork manufacturers throughout Europe, so that vocational bodies can be easily mounted on the chassis.
PACCAR Parts Achieves Excellent Financial Performance
First quarter 2026 revenues were $1.71 billion compared to $1.69 billion reported in the same period last year. PACCAR Parts achieved quarterly pretax income of $402.3 million, compared to $426.5 million earned in the first quarter of 2025. Bryan Sitko, PACCAR vice president and PACCAR Parts general manager, said, “PACCAR Parts provides aftermarket parts and transportation solutions that deliver greater uptime and profitability for customers. PACCAR Parts’ excellent performance reflects the benefit of investments in new parts distribution centers (PDCs), TRP all-makes parts, TRP stores, and world-class logistics capabilities.”
PACCAR Parts’ 21 global PDCs, with over 4 million square feet, support more than 2,000 DAF, Kenworth and Peterbilt sales, parts and service locations, and more than 350 TRP stores. These independent, well-capitalized dealers provide outstanding service to customers, complementing the premium quality of DAF, Kenworth and Peterbilt vehicles.
PACCAR Financial Services Achieves Strong Quarterly Profits
PACCAR Financial Services (PFS) achieved pretax income of $115.5 million in the first quarter of 2026 compared to $121.1 million earned in the first quarter of 2025. First quarter 2026 revenues were $542.2 million compared to $528.0 million in the same quarter of last year. “PFS achieved strong quarterly results due to its high quality portfolio,” said Craig Gryniewicz, PACCAR vice president. “PFS is a leader in the market with its superior Kenworth, Peterbilt and DAF products, innovative technologies that provide seamless credit application and loan processing, and its support of customers in all phases of the business cycle.”
PFS has a portfolio of 221,000 trucks and trailers, with total assets of $22.3 billion. PacLease, a major full-service truck leasing company in North America and Europe with a fleet of approximately 37,000 vehicles, is included in this segment. “PACCAR’s strong balance sheet, complemented by its A+/A1 credit ratings, enables PFS to offer competitive retail financing to Kenworth, Peterbilt and DAF dealers and customers in 26 countries on four continents,” said Terren Drake, PACCAR Financial Corp. president. “PFS has excellent access to the debt markets, issuing $400 million in medium-term notes during the first quarter of 2026.”
Capital and R&D Investments in Products, Technologies and Facilities
PACCAR’s consistent long-term profits, strong balance sheet, and focus on quality, technology, and innovation have enabled the company to invest $9.3 billion in world-class facilities, next generation products, and state-of-the-art technologies during the past decade. PACCAR invested $135.5 million in capital projects and $109.1 million in research and development expenses in the first quarter of 2026. Brice Poplawski, senior vice president and chief financial officer, said, “Capital expenditures are projected to be in the range of $725-$775 million and research and development expenses are estimated to be in the range $450-$500 million in 2026. PACCAR is increasing its investment in next generation internal combustion, hybrid and battery-electric powertrains, integrated connected vehicle services, expanded manufacturing capabilities, and the PACCAR autonomous vehicle platform, that will create value for our customers.”
PACCAR is a global technology leader in the design, manufacture and customer support of high-quality light-, medium- and heavy-duty trucks under the Kenworth, Peterbilt and DAF nameplates. PACCAR also designs and manufactures advanced powertrains, provides financial services and information technology, and distributes truck parts related to its principal business.
PACCAR will hold a conference call with securities analysts to discuss first quarter earnings on April 28, 2026, at 8:00 a.m. Pacific time. Interested parties may listen to the call by selecting “Q1 Earnings Webcast” at PACCAR’s homepage. The webcast will be available on a recorded basis through May 5, 2026. PACCAR shares are traded on the Nasdaq Stock Market, symbol PCAR. Its homepage is www.paccar.com.
This release contains “forward-looking statements” within the meaning of the Private Securities Litigation Reform Act. These statements are based on management’s current expectations and are subject to uncertainty and changes in circumstances. Actual results may differ materially from those included in these statements due to a variety of factors. More information about these factors is contained in PACCAR’s filings with the Securities and Exchange Commission.
PACCAR Inc |
||||||||
SUMMARY STATEMENTS OF OPERATIONS (Unaudited) |
||||||||
(in millions except per share amounts) |
||||||||
|
|
|
|
|
|
|
||
|
|
|
Three Months Ended |
|
||||
|
|
|
March 31 |
|
||||
|
|
|
2026 |
|
|
2025 |
|
|
| Truck, Parts and Other: | ||||||||
| Net sales and revenues | $ | 6,234.3 |
|
$ | 6,913.7 |
|||
| Cost of sales and revenues | 5,416.5 |
|
5,891.0 |
|||||
| Research and development | 109.1 |
|
115.4 |
|||||
| Selling, general and administrative | 149.6 |
|
143.3 |
|||||
| Interest and other (income) expense, net | (21.3 |
) |
325.8 |
(1) |
||||
| Truck, Parts and Other Income Before Income Taxes | 580.4 |
|
438.2 |
|||||
| Financial Services: | ||||||||
| Revenues | 542.2 |
|
528.0 |
|||||
| Interest and other | 342.9 |
|
350.3 |
|||||
| Selling, general and administrative | 39.7 |
|
38.3 |
|||||
| Provision for losses on receivables | 44.1 |
|
18.3 |
|||||
| Financial Services Income Before Income Taxes | 115.5 |
|
121.1 |
|||||
| Investment income | 80.4 |
|
83.8 |
|||||
| Total Income Before Income Taxes | 776.3 |
|
643.1 |
|||||
| Income taxes | 171.0 |
|
138.0 |
|||||
| Net Income | $ | 605.3 |
|
$ | 505.1 |
|||
| Net Income Per Share: | ||||||||
| Basic | $ | 1.15 |
|
$ | .96 |
|||
| Diluted | $ | 1.15 |
|
$ | .96 |
|||
| Weighted Average Shares Outstanding: | ||||||||
| Basic | 526.7 |
|
525.9 |
|||||
| Diluted | 527.4 |
|
526.9 |
|||||
| Dividends declared per share | $ | .33 |
|
$ | .33 |
|||
| (1) Includes a $350.0 million charge related to civil litigation in Europe (EC-related claims). | ||||||||
| PACCAR Inc | ||||||||
| CONDENSED BALANCE SHEETS (Unaudited) | ||||||||
| (in millions) | ||||||||
March 31 |
December 31 |
|||||||
2026 |
2025 |
|||||||
| ASSETS | ||||||||
| Truck, Parts and Other: | ||||||||
| Cash and marketable securities | $ | 8,595.4 |
$ | 9,253.7 |
||||
| Trade and other receivables, net | 2,256.9 |
1,981.1 |
||||||
| Inventories, net | 2,223.4 |
2,187.5 |
||||||
| Property, plant and equipment, net | 4,518.8 |
4,505.3 |
||||||
| Other assets | 3,610.8 |
3,605.2 |
||||||
| Financial Services Assets | 22,348.2 |
22,803.4 |
||||||
| $ | 43,553.5 |
$ | 44,336.2 |
|||||
| LIABILITIES AND STOCKHOLDERS' EQUITY | ||||||||
| Truck, Parts and Other: | ||||||||
| Accounts payable, deferred revenues and other | $ | 7,298.6 |
$ | 7,890.9 |
||||
| Financial Services Liabilities | 16,498.3 |
17,181.3 |
||||||
| STOCKHOLDERS' EQUITY | 19,756.6 |
19,264.0 |
||||||
| $ | 43,553.5 |
$ | 44,336.2 |
|||||
| Common Shares Outstanding | 526.2 |
525.4 |
||||||
| PACCAR Inc | |||||||
| CONDENSED CASH FLOW STATEMENTS (Unaudited) | |||||||
| (in millions) | |||||||
| Three Months Ended March 31 | 2026 |
2025 |
|||||
| OPERATING ACTIVITIES: | |||||||
| Net Income | $ | 605.3 |
|
$ | 505.1 |
|
|
| Depreciation and amortization: | |||||||
| Property, plant and equipment | 100.5 |
|
99.7 |
|
|||
| Other assets | 99.6 |
|
105.4 |
|
|||
| Net change in trade receivables, inventory and payables | (74.4 |
) |
(42.0 |
) |
|||
| Net decrease in wholesale receivables on new trucks | 198.7 |
|
28.8 |
|
|||
| All other operating activities, net | 42.1 |
|
213.3 |
|
|||
| Net Cash Provided by Operating Activities | 971.8 |
|
910.3 |
|
|||
| INVESTING ACTIVITIES: | |||||||
| Payments for property, plant and equipment | (147.2 |
) |
(165.1 |
) |
|||
| Acquisitions of equipment for operating leases | (170.7 |
) |
(160.7 |
) |
|||
| Net decrease (increase) in financial services receivables | 163.8 |
|
(198.3 |
) |
|||
| Net increase in marketable debt securities | (36.8 |
) |
(20.6 |
) |
|||
| Proceeds from asset disposals and other | 115.9 |
|
152.1 |
|
|||
| Net Cash Used in Investing Activities | (75.0 |
) |
(392.6 |
) |
|||
| FINANCING ACTIVITIES: | |||||||
| Payments of cash dividends | (909.4 |
) |
(1,747.0 |
) |
|||
| Purchases of treasury stock | (4.8 |
) |
(4.3 |
) |
|||
| Proceeds from stock compensation transactions | 42.4 |
|
22.5 |
|
|||
| Net decrease in debt and other | (679.9 |
) |
(405.9 |
) |
|||
| Net Cash Used in Financing Activities | (1,551.7 |
) |
(2,134.7 |
) |
|||
| Effect of exchange rate changes on cash | (8.2 |
) |
73.9 |
|
|||
| Net Decrease in Cash and Cash Equivalents | (663.1 |
) |
(1,543.1 |
) |
|||
| Cash and cash equivalents at beginning of period | 6,307.9 |
|
7,060.8 |
|
|||
| Cash and cash equivalents at end of period | $ | 5,644.8 |
|
$ | 5,517.7 |
|
|
| PACCAR Inc | ||||||||
| SEGMENT AND OTHER INFORMATION (Unaudited) | ||||||||
| (in millions) | ||||||||
Three Months Ended |
||||||||
March 31 |
||||||||
2026 |
|
|
2025 |
|||||
| Sales and Revenues: | ||||||||
| Truck | $ | 4,526.5 |
|
$ | 5,225.8 |
|
||
| Parts | 1,710.1 |
|
1,689.9 |
|
||||
| Financial Services | 542.2 |
|
528.0 |
|
||||
| Intersegment Eliminations and Other | (2.3 |
) |
(2.0 |
) |
||||
| $ | 6,776.5 |
|
$ | 7,441.7 |
|
|||
| Pretax Profit: | ||||||||
| Truck | $ | 176.2 |
|
$ | 364.9 |
|
||
| Parts | 402.3 |
|
426.5 |
|
||||
| Financial Services | 115.5 |
|
121.1 |
|
||||
| Investment Income and Other | 82.3 |
|
(269.4 |
) |
(1) |
|||
| $ | 776.3 |
|
$ | 643.1 |
|
|||
| GEOGRAPHIC REVENUE | ||||||||
| (in millions) | ||||||||
Three Months Ended |
||||||||
March 31 |
||||||||
2026 |
|
|
2025 |
|||||
| United States and Canada | $ | 4,051.8 |
|
$ | 4,627.3 |
|
||
| Europe | 1,808.9 |
|
1,568.6 |
|
||||
| Other | 915.8 |
|
1,245.8 |
|
||||
| $ | 6,776.5 |
|
$ | 7,441.7 |
|
|||
| NEW TRUCK DELIVERIES | ||||||||
Three Months Ended |
||||||||
March 31 |
||||||||
2026 |
|
|
2025 |
|||||
| United States and Canada | 17,800 |
|
22,200 |
|
||||
| Europe | 11,200 |
|
10,400 |
|
||||
| Other | 4,100 |
|
7,500 |
|
||||
33,100 |
|
40,100 |
|
|||||
| (1) Includes a $350.0 million charge related to civil litigation in Europe (EC-related claims). | ||||||||
| PACCAR Inc | ||||||
| SUPPLEMENTARY INFORMATION | ||||||
| RECONCILIATION OF GAAP TO NON-GAAP FINANCIAL MEASURES | ||||||
| (Unaudited) | ||||||
| “Adjusted net income (non-GAAP)” and “adjusted net income per diluted share (non-GAAP)” are financial measures that are not in accordance with U.S. generally accepted accounting principles (“GAAP”), since they exclude a charge for EC-related claims. These measures differ from the most directly comparable measures calculated in accordance with GAAP and may not be comparable to similarly titled non-GAAP financial measures used by other companies. | ||||||
| On July 19, 2016, the European Commission (EC) concluded its investigation of all major European truck manufacturers and reached a settlement with the Company. Following the settlement, legal proceedings seeking damages were filed against all major European truck manufacturers. In the first quarter of 2023, the Company recorded a pre-tax charge of $600.0 ($446.4 after-tax) for the estimable total cost. Several courts have issued judgments; some have been favorable while others have been unfavorable and have been appealed. The Company has settled with the majority of claimants and continues to pursue appropriate resolutions. Due to higher settlement costs, the Company updated its estimate and recorded an additional pre-tax charge of $350.0 ($264.5 after-tax) for the total estimable remaining costs in Interest and other (income) expenses, net in the first quarter of 2025. | ||||||
| The Company utilizes these non-GAAP measures to allow investors and management to evaluate operating trends by excluding a significant charge that is not representative of company performance. | ||||||
| Reconciliations from the most directly comparable GAAP measures to adjusted net income (non-GAAP) and adjusted net income per diluted share (non-GAAP) are as follows: | ||||||
| Three Months Ended | ||
| ($ in millions, except per share amounts) | March 31, 2025 | |
| Net income | $ | 505.1 |
| EC-related claims, net of taxes | 264.5 |
|
| Adjusted net income (non-GAAP) | $ | 769.6 |
| Per diluted share: | ||
| Net income | $ | .96 |
| EC-related claims, net of taxes | .50 |
|
| Adjusted net income (non-GAAP) | $ | 1.46 |
View source version on businesswire.com: https://www.businesswire.com/news/home/20260428555303/en/
Contacts
Ken Hastings
(425) 468-7530
ken.hastings@paccar.com
If you believe this article contains misleading, harmful, or spam content, please let us know.
Report this article